


ADMANAGER

Enterprise Entertainment SaaS Product
OVERVIEW

At HPE, I was tasked with the redesign consultation of one of our client's SaaS products. This was our biggest client project during my time at HPE. This product organized media ads for internet radio.

TIMELINE
18 Months
ROLE
UI Designer | Research Analyst
TOOLS
Pen and Paper | Sketch | Invision | User Data
Disclaimer
Due to licensing agreements, I am not allowed to display visual design deliverables on behalf of my client. You can still read the case study below where I have diagrams to explain my design process.
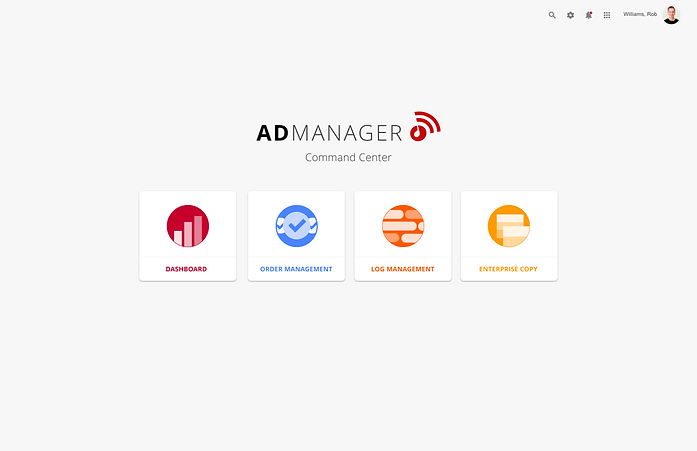
Discovery
Client Needs
At HPE, our media company client requested support with their ad management software redesign. This software was responsible for scheduling radio ads to stations and timeslots. We ran interviews with Ad Managers to see what they liked and disliked the most about their current SaaS experience. I found common feedback which centered around customizability and user flow.
"We would like our tables and dashboards to be updated as our product gets transferred to cloud native. We want more customizability and to make our dashboards easier to read."
"Not only does the dashboard make it hard to create new ad slots, the tables containing ad assets to assign is impossible to navigate and find anything."
"Not only does the dashboard make it hard to create new ad slots, the tables containing ad assets to assign are impossible to navigate and find anything."
Research & Testing
94%
Wanted to continue playing the games weekly
74%
Said they would pay money for a premium competition.
98%
Admired the combination of competition and social features in a stock market app
Define
Based on the findings from our client interviews, as a team, we needed to deliver a solution that focused on data visualization, user flows & improved table features. We defined our requirements as:
-
Providing a new dashboard layout that tracks employee's ad creation
-
Improved dashboard visualizations
-
Make new ad creation flow more navigable
-
More robust table functionality for assigning ad space
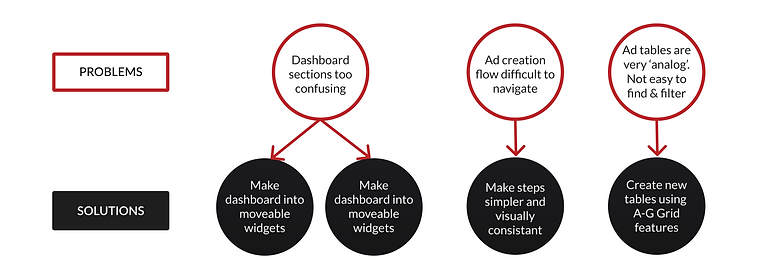
I explored and researched different data tables as well as dashboard structures to help see get a sense of what makes a successful SaaS product. This led us to the discovery of new dashboard and table features and key value props:
1
Ease of use
2
Detailed filtering
3
Improved ad creation flow
4
Easily digestible data visualizations
Design
Due to licensing agreements, I am not allowed to display visual design deliverables on behalf of my client.
Results
Due to licensing agreements, I am not allowed to display visual design deliverables on behalf of my client.
94%
Wanted to continue playing the games weekly
74%
Said they would pay money for a premium competition.
98%
Admired the combination of competition and social features in a stock market app